


Quick answer: Business efficiency in a residential cleaning company comes from knowing a short list of numbers every week: revenue, labor percentage, gross margin, net profit, cash, effective hourly rate, client retention, close rate and quality. When you track those numbers on a simple scorecard and review them on a fixed rhythm, you stop guessing and start making decisions that protect profit.
Most cleaning business owners did not start their companies because they love spreadsheets. They started because they were great at cleaning, great with clients, or ready to build something of their own. The numbers came later, along with any real focus on business efficiency, usually in a panic at tax time or when payroll felt tighter than it should. This guide shows you which figures matter most, how to read them, and how to build a weekly habit that converts them into better decisions and lasting business efficiency.
Why business efficiency starts with your numbers
Business efficiency means getting more of the results you want from the time, labor and money you already have. In a cleaning company, that sounds simple. In practice, it is hard to see without data, because the work happens in clients’ homes, spread across many teams and many days.
Without numbers, owners tend to manage by feel. A busy week feels profitable. A quiet week feels like a crisis. Neither feeling tells you whether your pricing covers your labor, whether your best clients are staying, or whether you will have enough cash for next month. Numbers give you an honest picture so you can act early instead of reacting late.
There is also a leadership reason. When your team can see the same numbers you see, conversations become calmer and more objective. You are no longer saying “we need to do better.” You are saying “our re-clean rate went up this week, so let’s look at what changed.” That is business efficiency in action: less emotion, more clarity, faster fixes.
The 9 numbers that drive business efficiency in a cleaning company
You do not need fifty metrics. You need a handful you understand deeply and review consistently. These nine cover money, people, clients and quality, which together tell you how healthy the business really is.
1. Revenue, and how much of it recurs
Track total revenue weekly, then split it into recurring service (weekly, biweekly, monthly clients) and one-time work such as deep cleans and move-outs. Recurring revenue is more predictable and easier to schedule, so knowing the mix helps you plan staffing and cash with more confidence. Predictable revenue is the base layer of business efficiency.
2. Labor percentage
Labor percentage is total field labor cost (wages, payroll taxes and related costs) divided by revenue. It is usually the largest single expense in a residential cleaning company, which makes it one of the most important business efficiency numbers you can watch. If it creeps up, look at drive time, job overruns, overtime and pricing before you look anywhere else.
3. Gross margin
Gross margin is what remains after direct job costs: labor, supplies and anything else tied to delivering the clean. It tells you whether each job, and each service type, actually funds the rest of the company. Calculate it by service line when you can, because a healthy overall margin can hide a service that loses money.
4. Net profit
Net profit is what is left after every expense, including your own fair pay. Many owners leave their salary out of the math, which makes the company look healthier than it is. Pay yourself on paper first, then measure profit. That is the only way to know whether the business could run without you doing unpaid work.
5. Cash on hand
Profit and cash are not the same thing. You can be profitable on paper and still struggle to make payroll if clients pay late or a big expense lands at the wrong time. Track cash weekly and know how many weeks of operating costs you could cover if revenue paused.
6. Effective hourly rate
Divide revenue from a job by the actual labor hours it took. This effective hourly rate shows whether your pricing holds up in the real world. When a job is quoted for three hours but routinely takes four, your rate drops and your business efficiency drops with it.
7. Client retention
Track how many recurring clients you keep each month and how many cancel. Losing clients means paying again to replace them, so retention is one of the quietest drivers of profit. Note the reasons people leave; patterns usually point to a fixable issue in quality, scheduling or communication.
8. Lead conversion rate
Of the people who ask for a quote, how many become clients? Close rate tells you how well your sales process works and whether your marketing is attracting the right buyers. A low close rate with plenty of leads is a sales problem, and it drags down business efficiency because marketing dollars go to waste. A high close rate with few leads is a marketing problem.
9. Quality and re‑clean rate
Count complaints and re-cleans as a share of completed jobs. Quality issues hurt business efficiency twice: the labor to go back and the trust you may lose with the client. Watching this number weekly keeps quality conversations factual and helps you coach teams before small issues become costly for everyone involved.
For a deeper look at choosing and tracking these metrics, see our guide to building a weekly KPI scorecard for a cleaning business.
How to build a business efficiency scorecard
A scorecard is a one-page view of your most important numbers, updated every week. It should take minutes to read, not hours. The goal is to spot trends early and decide what needs attention this week. A good business efficiency scorecard answers one question fast: are we on track?
- Pick 8 to 12 measurables. Start with the nine above and add only what you will actually use for business efficiency decisions.
- Assign an owner to each number. One person is responsible for reporting it and explaining changes.
- Set a target for each. Base targets on your own history and goals rather than someone else’s benchmark.
- Show 13 weeks at a glance. A quarter of data reveals trends that a single week hides.
- Mark anything off target. Off-target numbers become discussion items, not blame.
Keep the format consistent. When the same numbers appear in the same order every week, your team learns to read them quickly, and business efficiency improves because problems surface faster. Tools like GET (Growth Execution Tool) in the Align Operating System are built for this kind of KPI tracking, commitments and accountability.
Pricing: where business efficiency is won or lost
No amount of cost cutting can fix pricing that is too low. If your rates do not cover labor, supplies, overhead and a fair profit, every new client adds work without adding much reward. That is why pricing deserves its own review, separate from day‑to‑day operations.
Start by calculating your true cost per labor hour, including payroll taxes, drive time and non-billable time. Then compare it to your effective hourly rate by service type. The gap between the two is your real margin. If the gap is thin, you have three levers: raise prices, reduce time per job through better systems, or change the mix of services you sell.
Price increases feel risky, yet they are often the fastest path to better business efficiency. Communicate them clearly, give notice, and explain the value clients receive. Our article on how to price cleaning services for profit walks through the full method.
Running the business by the numbers each week
Numbers only help when they shape decisions. The owners who get the most from their data build a simple weekly rhythm around it.
- Update the scorecard before your leadership meeting so everyone arrives with the same facts.
- Review trends, not just this week. Ask whether a number is improving, flat or slipping over several weeks.
- Discuss off-target items and identify the real cause before choosing a fix.
- Assign clear commitments with an owner and a due date.
- Follow up next week so commitments become completed actions.
This rhythm fits naturally inside a weekly leadership meeting. Over a quarter, the scorecard also shows which priorities deserve attention next. That connects daily business efficiency to bigger goals, the kind of work covered in our guide to setting quarterly priorities.

Common mistakes that quietly drain efficiency
Even owners who track numbers can fall into habits that weaken the value of their data. Watch for these patterns.
- Looking only at revenue. Growth can hide shrinking margins. Always pair revenue with labor percentage and profit.
- Reviewing numbers monthly or quarterly only. By the time a monthly report arrives, a problem has already cost you several weeks.
- Leaving owner pay out of profit. This creates a business that only works because you subsidize it.
- Measuring without acting. A scorecard without commitments is just a report.
- Keeping numbers secret from leaders. Your team cannot help improve what they cannot see.
Many of these issues show up as hidden profit leaks: unbilled time, underpriced add-ons, redo work and scheduling gaps. If you suspect money is slipping away, read our breakdown of cleaning business profit leaks and the systems that stop them.
How business efficiency fits the Align Operating System
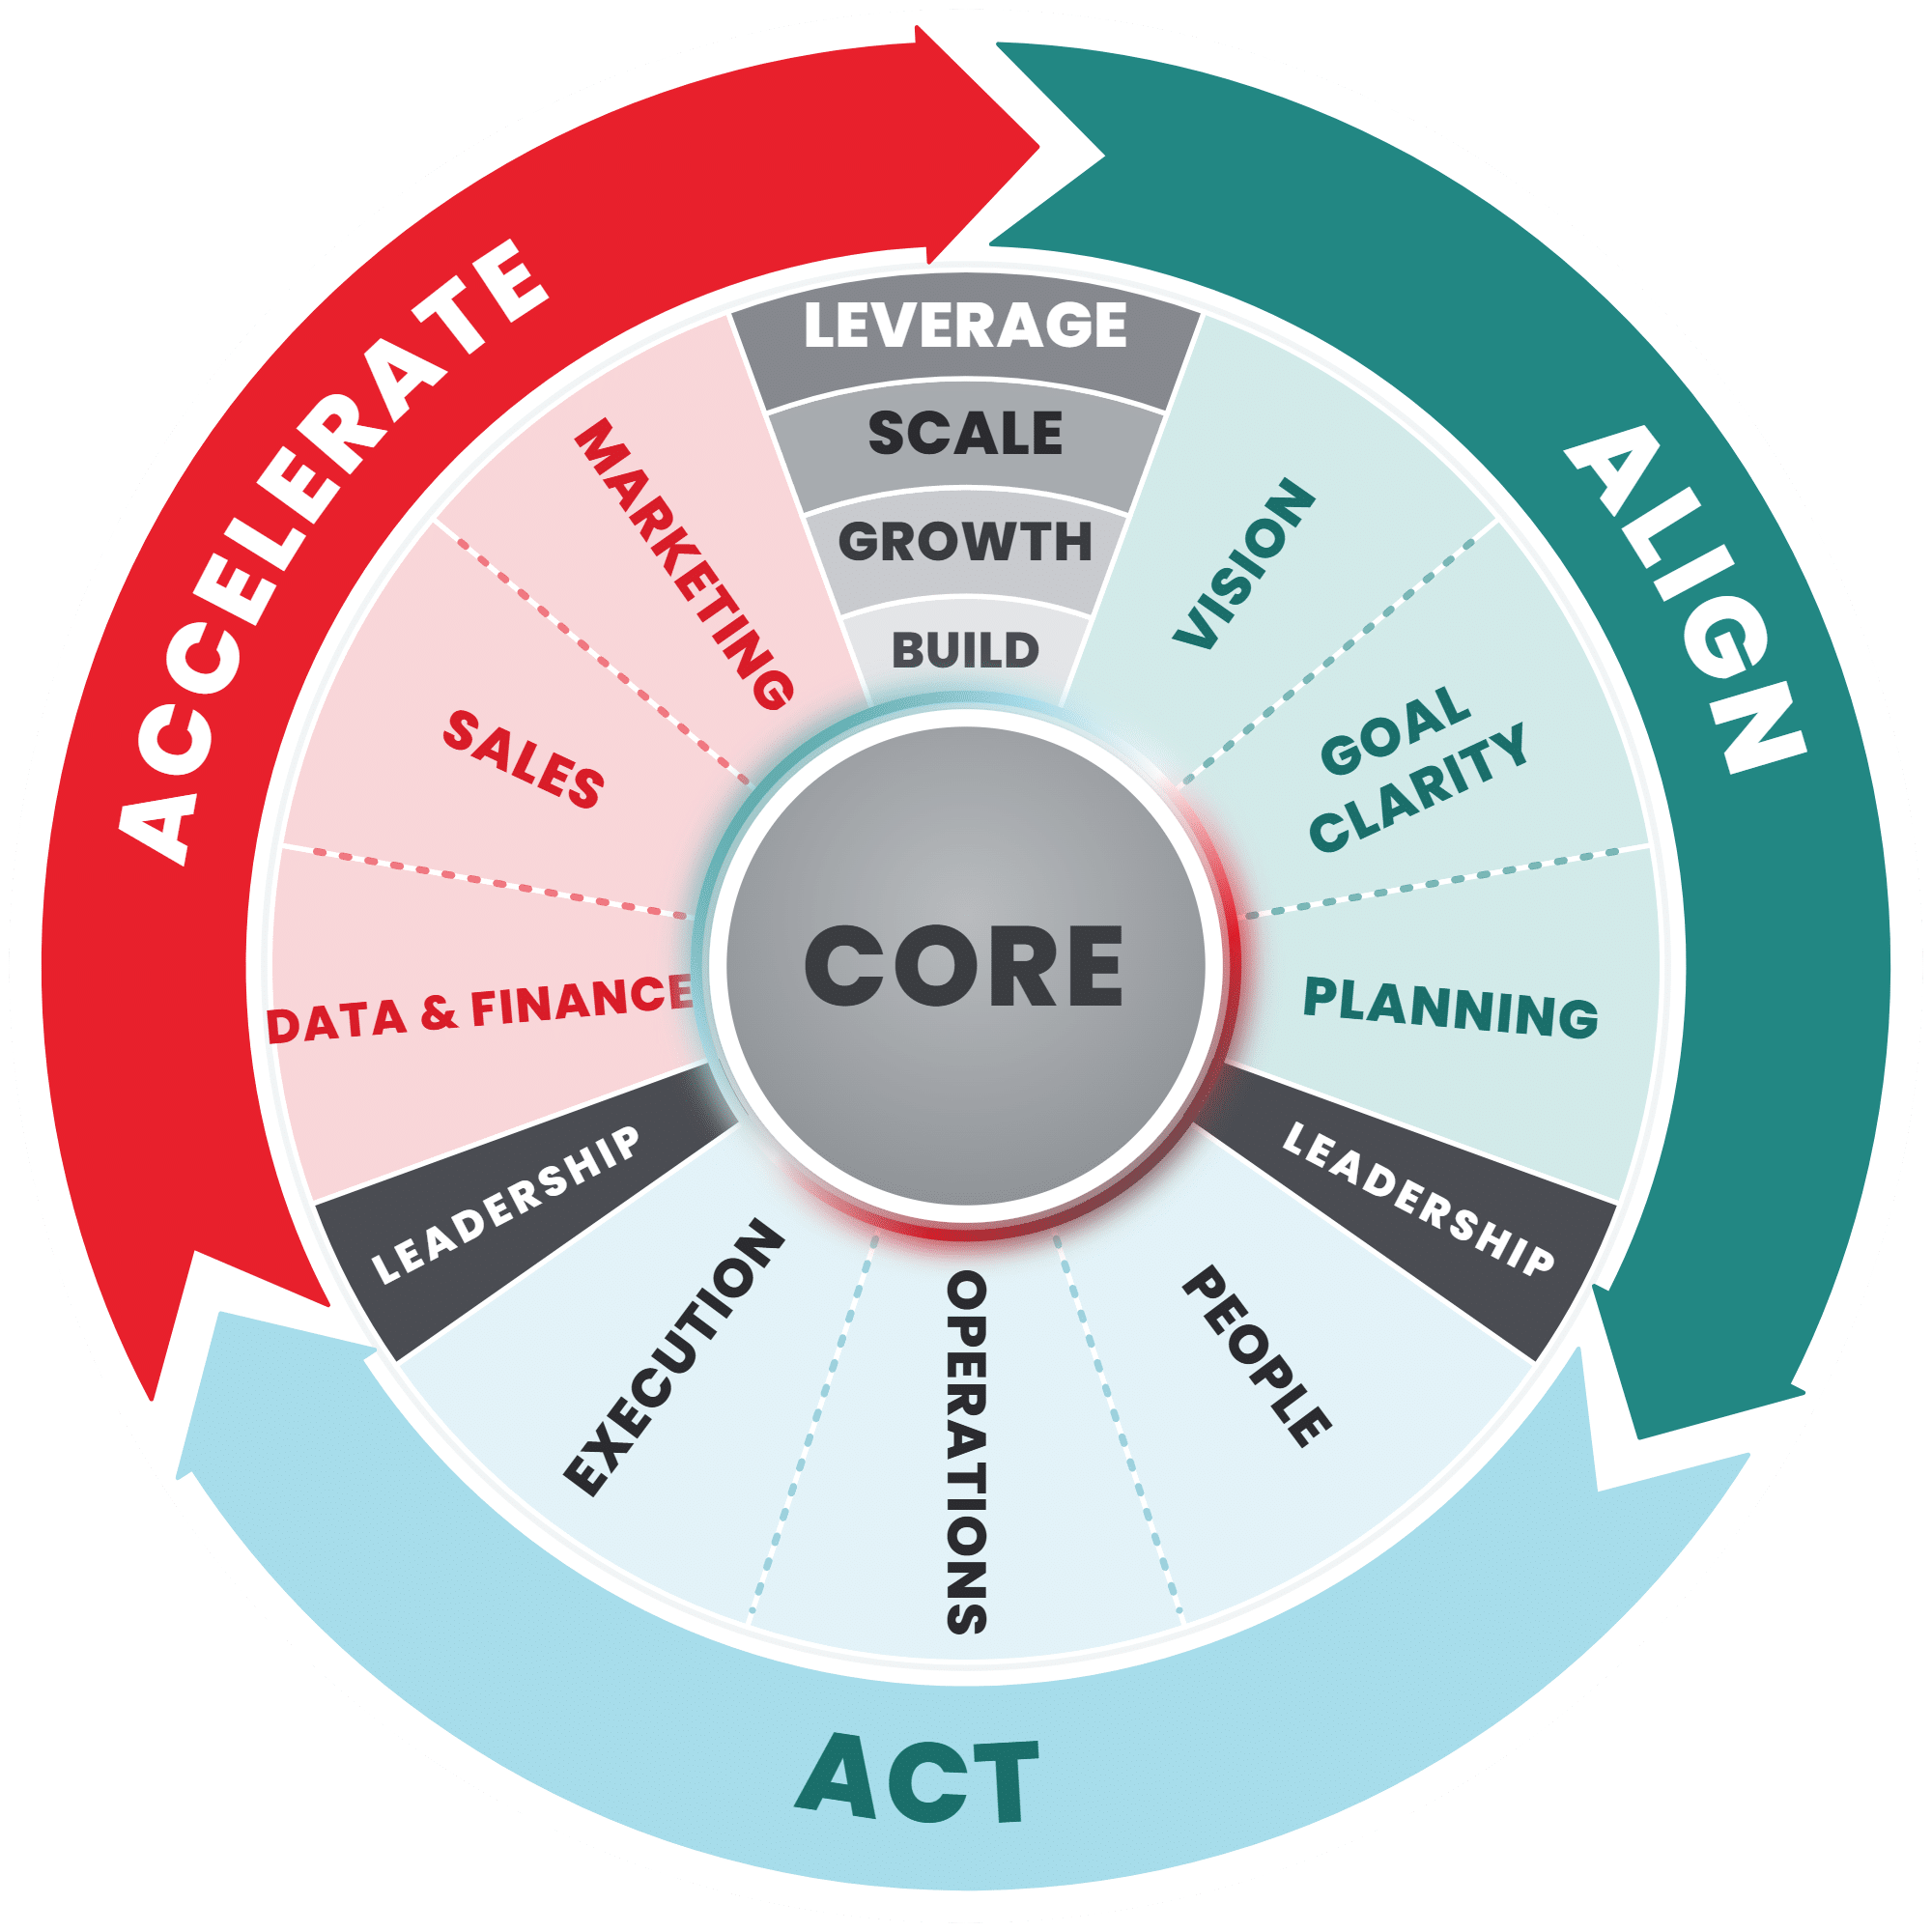
The Align Operating System (AOS) was created by Core Profit Builders specifically for residential cleaning companies. It organizes the business into three phases: Align (Vision, Goal Clarity, Planning), Act (People, Operations, Execution) and Accelerate (Data & Finance, Sales, Marketing), with Leadership running through every pillar.
Numbers live mainly in the Data & Finance pillar, yet they touch every part of the company. Labor percentage depends on Operations and People. Close rate depends on Sales. Retention depends on Execution and quality. That is why business efficiency is not a finance project alone; it is a whole-company habit supported by clear pillars and shared language.
AOS describes five levels: Core, Build, Growth, Scale and Leverage. Each level builds on the last, with increasing capability across the same operating system. You can read more in the five levels of AOS. The free AOS Diagnostic gives you an AOS Score from 0 to 100, your current level and pillar scores. Use your scores to identify gaps, then choose priorities based on your goals and what needs to happen first.
For general financial management resources, the U.S. Small Business Administration offers a helpful guide to managing your business finances and operations, and SCORE provides free mentoring if you want an outside set of eyes on your books.

Your first 30 days
- Week 1: Gather the last 13 weeks of revenue, payroll and job data. Calculate your labor percentage, gross margin and effective hourly rate by service type.
- Week 2: Build a one-page scorecard with your 8 to 12 most important numbers. Assign an owner and a target to each one.
- Week 3: Hold your first numbers-focused leadership meeting. Review trends, discuss off-target items and assign clear commitments.
- Week 4: Review your pricing against true labor cost. Decide whether any service needs a price change or a process fix, and take the free AOS Diagnostic to see your pillar scores.
Key takeaways
- Business efficiency comes from tracking a short list of numbers every week, not from tracking everything.
- Labor percentage, gross margin, net profit and cash are the core financial health checks for a cleaning company.
- Effective hourly rate, retention, close rate and re-clean rate show how well operations, sales and quality are working.
- Pricing is the biggest lever; costs cannot fix rates that are too low.
- A weekly scorecard plus a leadership meeting converts numbers into commitments, follow-through and steady business efficiency gains.
Next step: Take the free AOS Diagnostic to see how your Data & Finance pillar compares with the rest of your company, then build your first scorecard this week.
Frequently asked questions
What does business efficiency mean for a cleaning company?
Business efficiency means getting the most profit, quality and client loyalty from the labor, time and money you already have. For a residential cleaning company, it shows up in a healthy labor percentage, an effective hourly rate that matches your pricing, strong retention and few re‑cleans.
Which numbers should a cleaning business owner check every week?
Check revenue, labor percentage, gross margin, cash on hand, effective hourly rate, client retention, lead conversion rate and re-clean rate every week. Review net profit at least monthly, and always include your own fair pay in the calculation.
How do I calculate labor percentage?
Add up total field labor cost for a period, including wages, payroll taxes and related costs, then divide it by revenue for the same period. Track it weekly so you can spot drive time, overtime or pricing problems early.
How often should I review my scorecard?
Review it weekly in a short leadership meeting. Weekly reviews catch problems while they are small, while looking at 13 weeks of history shows trends that help you plan quarterly priorities and improve business efficiency over time.
Do I need special software to run my business by the numbers?
No. A simple spreadsheet works to start. What matters is consistency: the same numbers, reviewed on the same day, with clear owners and commitments. Tools such as GET in the Align Operating System add structure for KPI tracking and accountability as you grow.
Turn these ideas into consistent action
Mastery Circle gives owners weekly goal check-ins with Liz, KPI review, group feedback and accountability.
Not sure where to focus? Take the optional AOS Diagnostic.

Founder of Core Profit Builders and creator of the Align Operating System (AOS). Part owner in six cleaning companies. Certified High-Performance Coach (CHPC) and co-host of the Smart Business Moves podcast.
More about Liz